Ohio Farmland Undervalued? Not So Fast!
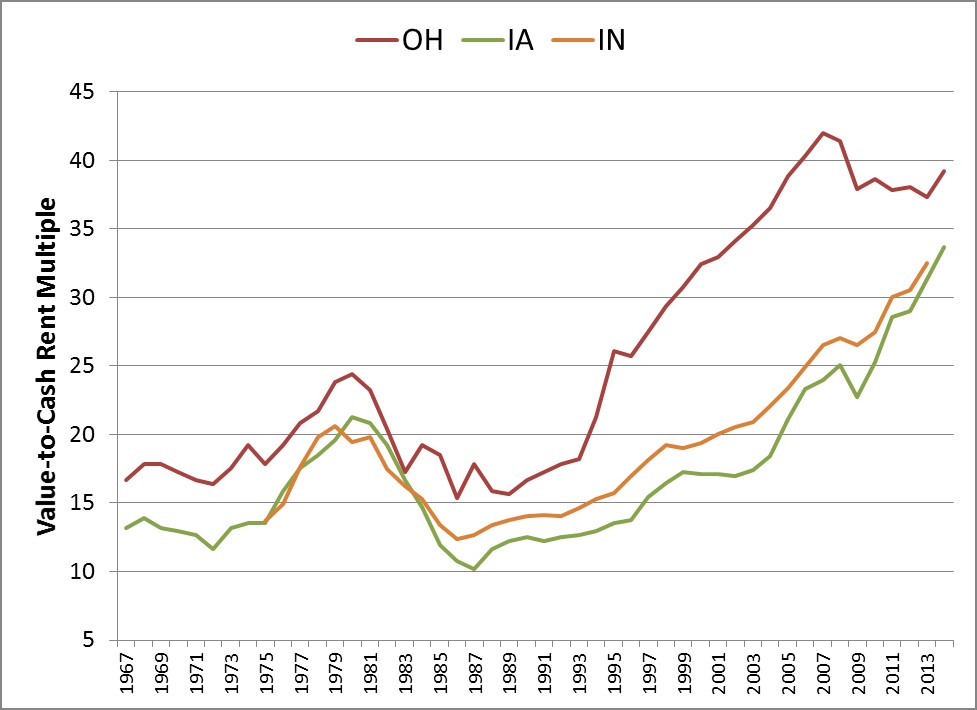
I was recently preparing for a presentation in Ohio and put together a chart that really surprised me. The chart below shows real farmland prices from 1960 to 2014 for Iowa, Indiana, and Ohio. I have used similar versions of this chart throughout the Midwest and typically find that farmland values have risen dramatically in this region. For instance, over the period of 2004 to 2014 real farmland values in Iowa, Illinois, Indiana, and Nebraska have risen by a high of 224% (Nebraska Irrigated farmland) to a low of 105% (Indiana). The reasons for these dramatic increases have been well documented. But I was really surprised that real Ohio farmland values have only gone up by 55%. After checking the USDA reported values several times – I was still perplexed. Most people might look at the chart below and think that Ohio is very cheap relative to Iowa.