Debt has always played a key role in capital intensive U.S. agricultural system. At times, such as the farm crisis of the 1980’s, too much debt has been problematic. However, most often it has been a useful tool that has allowed a massive substitution of capital for labor to take place.
So What Has Been Happening with Debt?
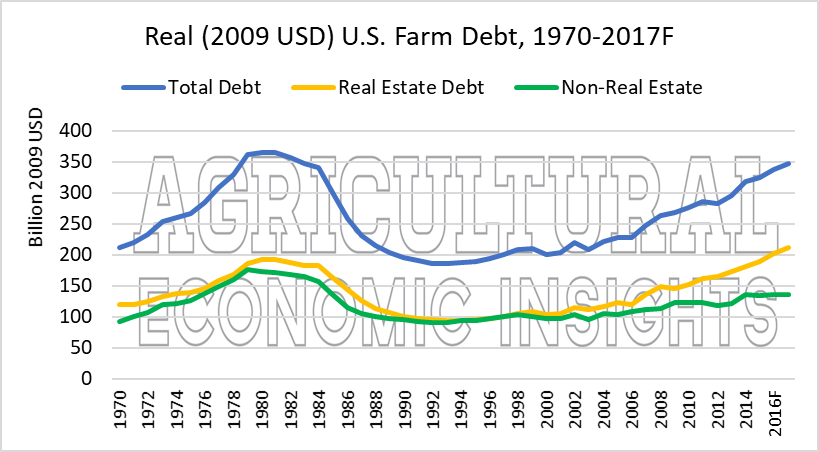
Total debt in the farm sector has increased in recent years. Today, the Economic Research Service estimates that nominal farm debt in the U.S. totals $395 billion, with 61% of that debt real estate debt and the remaining 39% non-real estate debt. Here we will focus on real (inflation adjusted to 2009 US dollars) debt which is plotted in Figure 1. The figure shows the estimate of the total debt as well as a breakdown of that used for real estate and non-real estate purposes.
Figure 1. Real (2009 USD) U.S. Farm Debt, 1970-2017F.
There are a few things worth noting about this chart. First, the inflation adjusted total amount of debt is now approaching the highest levels seen in the data. In 2009 USD the total debt is $17.8 billion under the peak. If debt were to increase 5% from current levels it will exceed the peak set in 1980. Second, real estate debt has exceeded non-real estate debt in every year of the data. Non-real estate debt nearly exceeded real estate debt for a period in the mid 1990’s. Today, the gap between real estate debt and non-real estate debt is as large as at any time shown in the graph.
Real Estate Debt Leads Use Higher
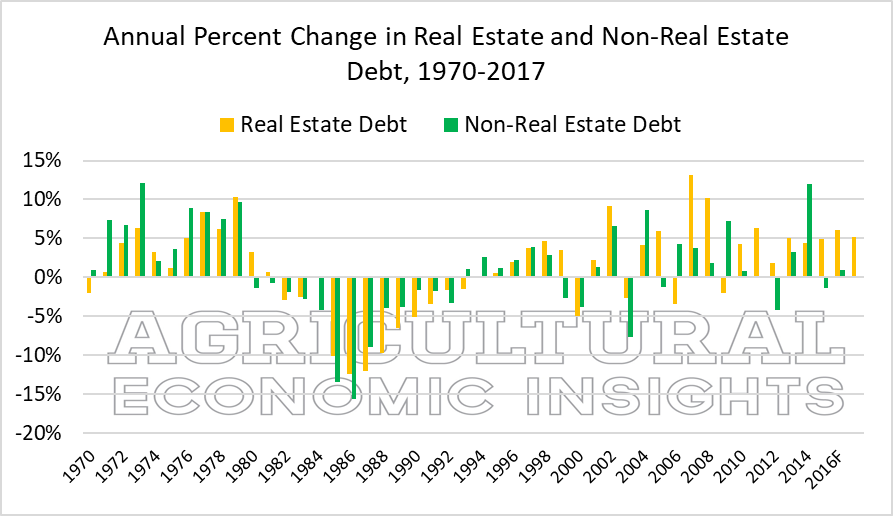
Debt use has been increasing rather steadily since the early 2000’s. Most of the increase in total debt use has been driven by strong growth in real estate debt. Figure 2 shows the annual percentage change in non-real estate and real estate debt. As one can see, both types of debt use have regularly increased since 1994. Since that time, total debt use has declined only 3 times. Of the two types of debt, real estate debt has seen the most consistent increases, only declining 3 times in those 17 years. Non-real estate debt on the other hand, declined 8 times over that span. The last time real estate debt levels declined was 2009, and since then has regularly notched increases near 5% per year.
Figure 2. Annual Percentage Change in Real Estate and Non-Real Estate Debt, U.S. Farm Sector 1970-2017F.
The other thing that is quite notable is that the data tend to suggest some rather long periods of increasing and decreasing debt use. This can be seen clearly in Figure 3 which shows the annual percentage change in debt use from 1960-2017F. For instance, starting in 1960 total debt use increased every year except 1968 and 1970 which saw very modest declines. Then, as the farm crisis began debt use declined every year from 1981 to 1994. Since that time debt use has increased every year except 2000, 2004, and 2012.
Figure 3. Annual Percentage Change in Total Debt, U.S. Farm Sector 1960-2017F.
Wrapping it Up
Total debt use in agriculture has increased significantly in recent years. If total debt were to increase at last year’s rate of 3% per year, total debt would exceed its inflation adjusted peak in two more years. One notable fact about the recent changes in debt use is that they have been driven by increases in real estate debt. Today, real estate debt accounts for a greater proportion of total debt that at any time in the ERS data set.
There are a variety of things that one should consider when looking at total debt use. Of course, debt use should always be considered relative to the income generation of the sector. This is something that we will soon evaluate in another post. The key question is whether cash flow available for debt use has kept pace with the increases in debt.
The rapid increases in real estate debt indicate that farmers have aggressively leveraged farm real estate as farm incomes have declined. This makes closely monitoring the farmland market and farmland values even more important in the future.
Finally, it is always important to remember that these are measures of debt at the sector level. The farming sector is quite diverse with many kinds of enterprises producing different products each with their own economic returns, production conditions, and capital requirements. As we go forward it will be critical to monitor financial conditions throughout these sectors and regions. It is certainly too early to say that debt use has increased too much, but it is also likely prudent to pay close attention to debt levels going forward.


