
Maybe it’s just me, but it seems that there have been a large number of recent articles in the press about the negative situation in the farm economy (for example 1, 2, 3, 4, 5 you get the idea). This was further driven home when a friend recently called to ask just how bad economic conditions are on the farm. I thought it might be a good time to provide some analysis of the current situation.
Net Farm Income is Low
There is no question that net farm income in the U.S. has fallen and remains at very low levels. Figure 1 provides a historical perspective. For 2018 income, real net farm income is forecast at $59.5 billion, which is 44% of the 2013 peak. We have arrived at that level through a series of repeated declines. The first two years of the decline left income at levels that were still reasonable, but the last three years have seen income between 59.5 and 65 billion dollars. These three years are very near the bottom of the historical range. In fact, to find three consecutive years with a lower average income level than this period you must go back to the early and mid-1980s.
 Net Farm Income, U.S. 1970-2018f.")
Figure 1. Real (2018 USD) Net Farm Income, U.S. 1970-2018f.
Low Income in All Regions
The economic pain in the corn belt is well documented for our readers, but I wanted to take a broader look here. The Economic Research Service (ERS) divides the country into farm resource regions which are shown in the map below along with the percentage change in the farm business average net cash farm income from 2017 to 2018.
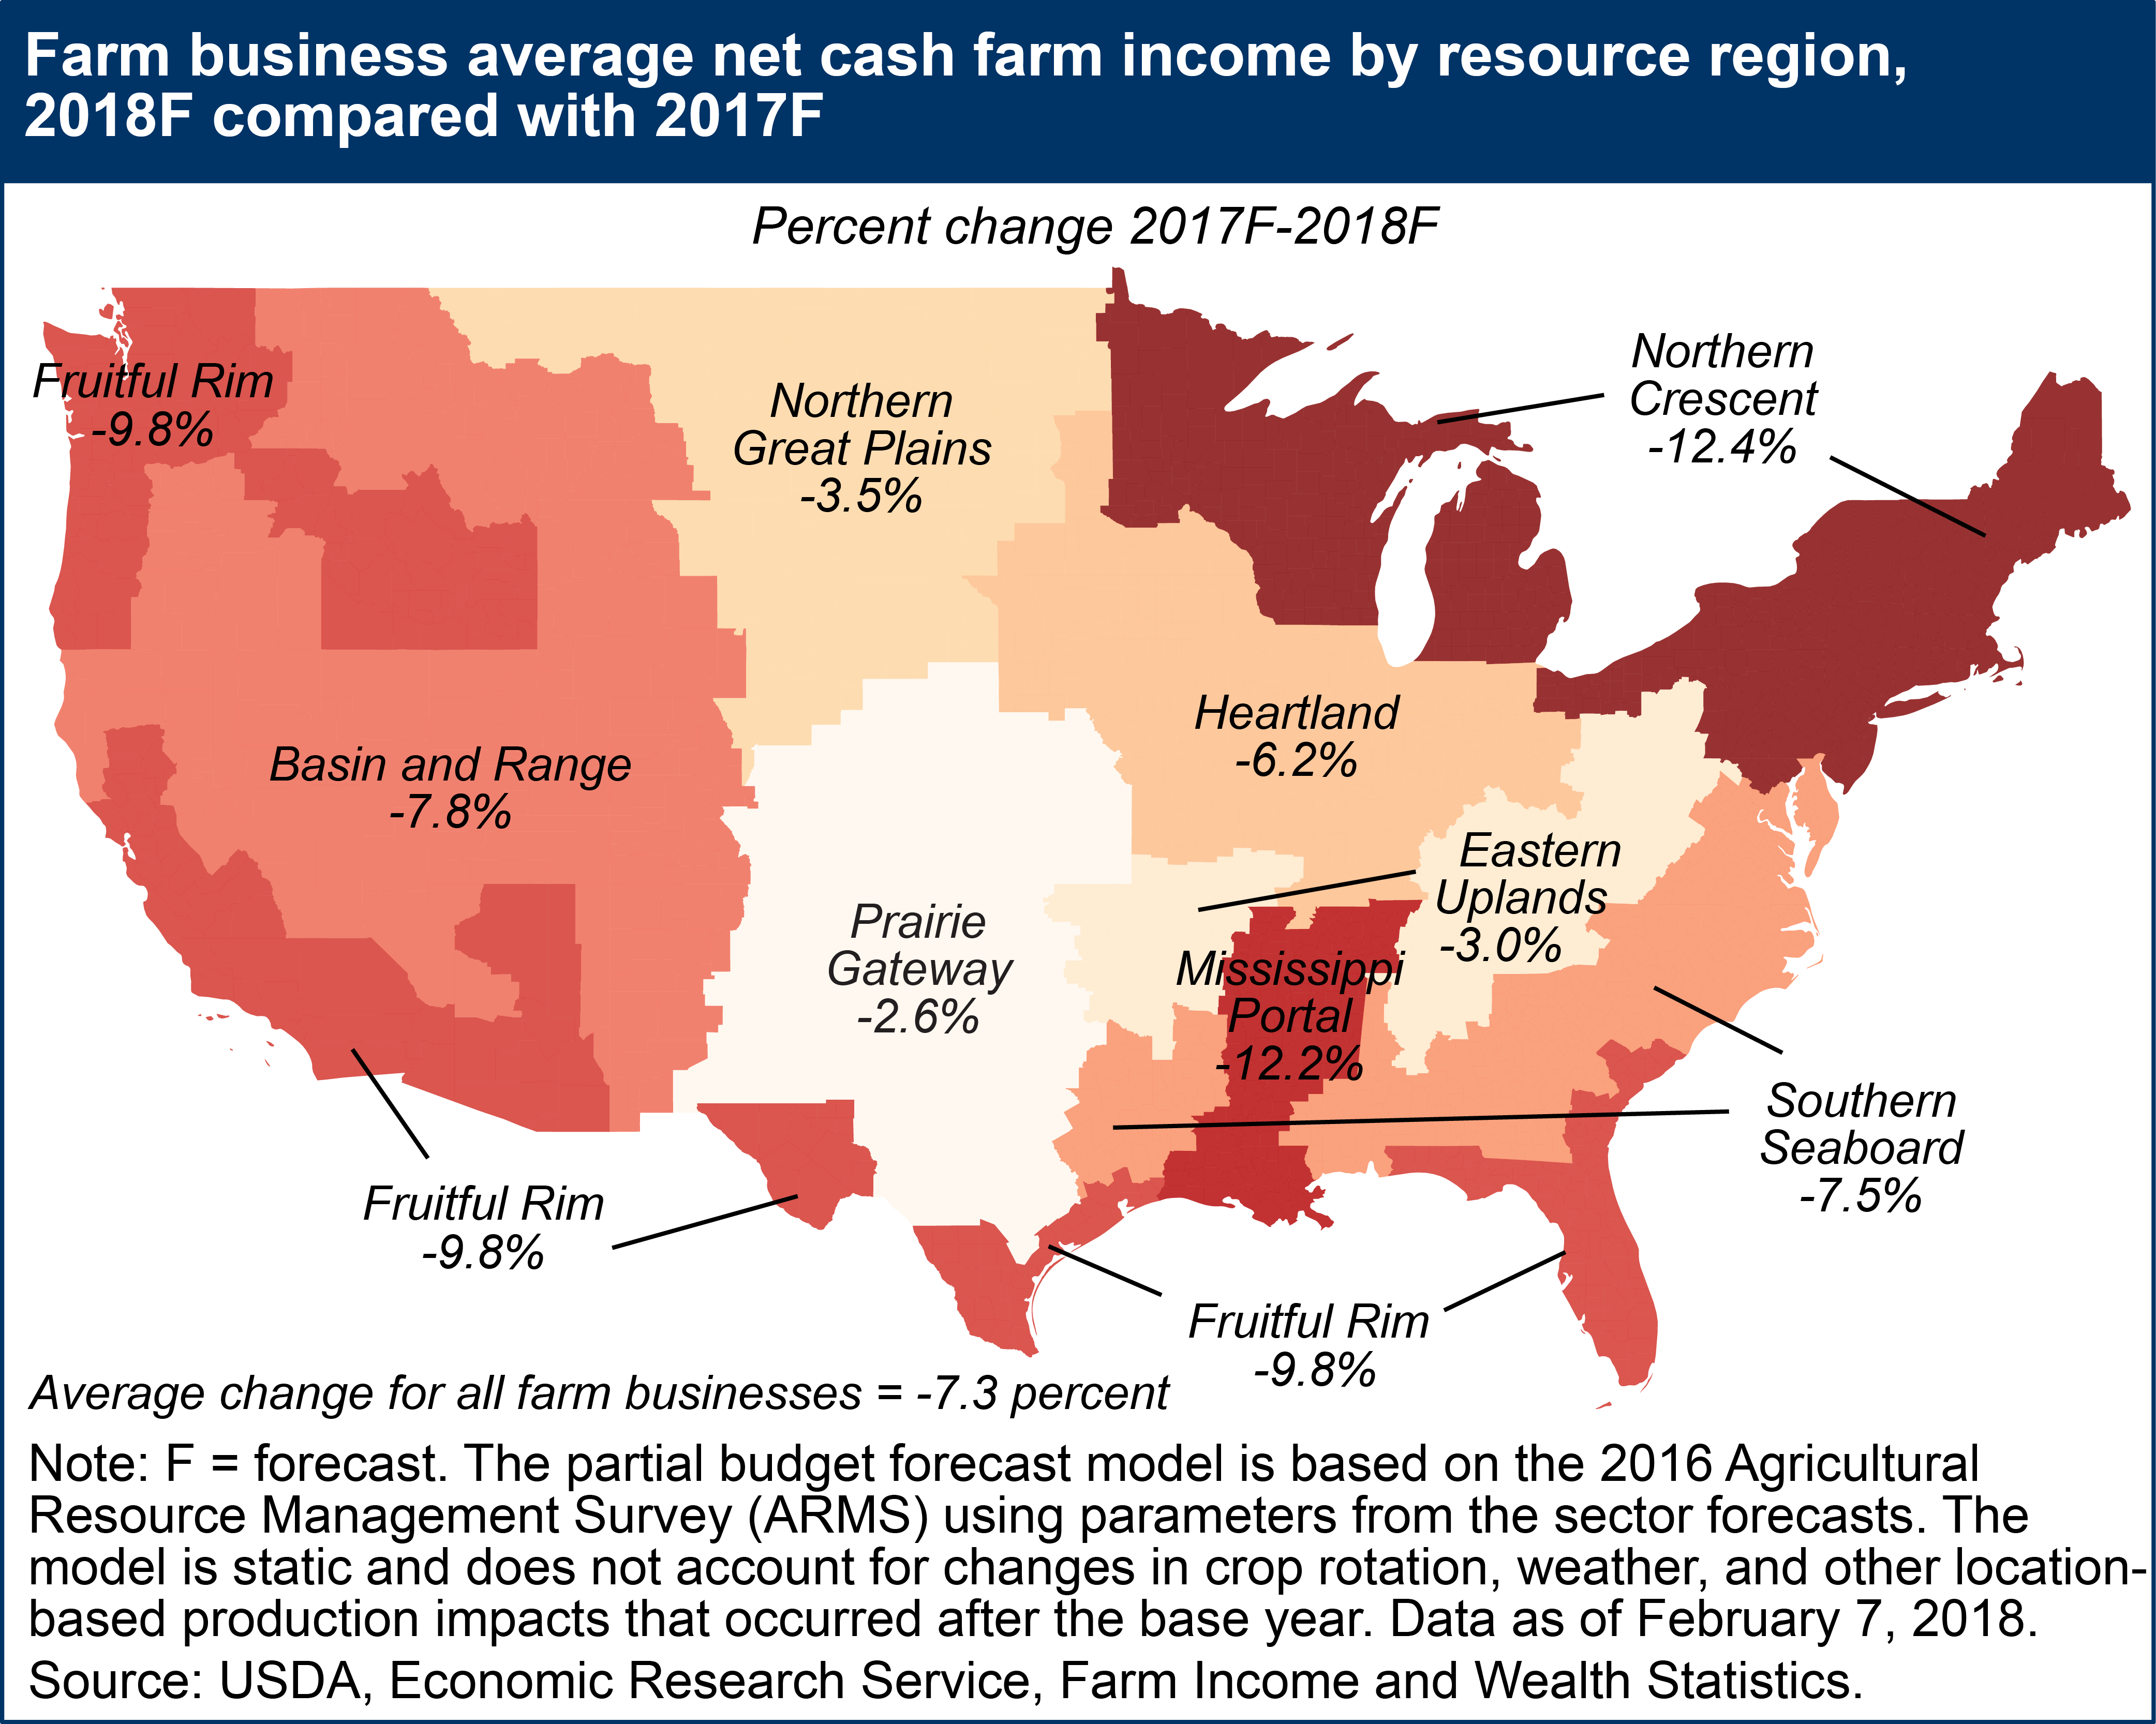
Figure 2. The Economic Research Service’s Map of Changes in Forecast Farm Business Net Cash Farm Income from 2017 to 2018. Source
The data in this figure are based on changes in farm business net cash income. According to ERS Farm businesses are identified as follows:
“Farm businesses (farms with annual gross cash farm income of over $350,000 or smaller operations where farming is reported as the operator’s primary occupation) account for less than half of U.S. farms, but contribute over 90 percent of the farm sector’s value of production and hold the majority of its assets and debt.”
As one can see even with a poor 2017, the situation is projected to deteriorate in every region of the U.S. in 2018. The Heartland region which encompasses the majority of the Corn Belt shows a decline of 6.2% for the year. Other regions are expected to fair even worse. Of note are the Mississippi portal and Northern Crescent which are expected to see double-digit declines. The best forecast, only a 2.6% decline, is for the Prairie Gateway.
To look how the economic situation varies across the country we calculated the average farm business net cash income from 2010 to 2015 (a generally good period) and compared it to 2018’s forecast (shown in the blue bars). We also compared 2018 to the highest net cash income achieved in each region from 2010 to 2015 (shown in the red bars).
 Figure 3. 2018 Farm Business Net Cash Income as a Percent of Previous Periods.
This graphic shows that the ERS’s 2018 forecast is generally bad for nearly every region. The blue bars show most regions at near 80% of the average from 2010-2015. When compared to the maximum net cash income over the period, the depth of the downturn is even more evident. This is particularly true in the Eastern Uplands, Basin and Range, Mississippi Portal and Northern Great Plains.
The conditions in the Prairie Gateway surprised me a bit given the amount of wheat grown in that region (and we know wheat hasn’t been good lately). So we calculated the same ratios by commodity. These are shown in Figure 4.
 Figure 4. 2018 Farm Business Net Cash Income as a Percent of Previous Periods by Commodity Specialization.
Readers here know that wheat has been bad, but the magnitude of the downturn even surprised me, with 2018 net cash income forecast at 25% of the average from 2010-2015. The average farm business specializing in wheat is expected to have a net cash income of $32,000 in 2018. Clearly, that is a challenging environment. ERS doesn’t break out their forecast of 2018 net farm income (including depreciation), but if they did you can imagine that wheat farms would show some large economic losses.
The 2018 forecast is not particularly good for most crops with the exception of cotton, which is showing an improvement. Specialty crops and other livestock are also near their averages from 2010-2015. In general, the economic situation for most commodities and regions continues to be a struggle.
Wrapping it Up
There is no denying that the overall picture that is painted with the data above is rather bleak. The overall farm income situation is notable in that there are currently few bright spots in the ERS forecast. Most regions are commodities are experiencing the downturn.
There are plenty of additional storm clouds including the drama surrounding agricultural trade, ethanol policy drama, declining government program payments, and rising interest rates. Should commodity prices fall much further, it will again expose many farms to economic losses. Given the string of poor years that the sector has had it is clearly very important to carefully manage this risk. This is particularly true of farms with relatively high levels of financial leverage.
All this said, when my friend called to ask about the situation I offered a somewhat upbeat response. I argued that there are signs that the downward trend in income is slowing. Most importantly these include an improved cost structure particularly for corn and soybean farmers. This benefit along with slightly higher commodity prices are offering the chance for farmers to sell at prices that actually generate a slight economic profit. This is very much an improvement over recent years. In our opinion it is important to take advantage of these opportunities when possible.