With 2019 planting season underway – at least by the calendar – the focus will soon shift to yields and production. In fact, the May USDA WASDE report will be an important starting point for 2019/2020 discussion. While it is still early, this week’s post reviews the current corn ending stocks situation and considers possible scenarios for 2019/2020.
Ending Stocks
Before diving in possible 2019/2020 scenarios, it is helpful to establish the baseline. For the crop harvested last fall, the 2018/2019 marketing year ending stocks are currently forecasted at 14.0% – the lowest levels since 12.7% in 2015/2016. Corn ending stocks, in recent memory, have ranged from a high of nearly 16% (2016/2017) to a low of 7% (2012/2013).
While current ending stocks are among the highest in recent years, the long-run provides a bit of perspective. Figure 1 shows U.S. corn ending stocks since 1960. It is worth noting that at several times in the 1990s and early 2000s corn ending stocks approached 20% of use. Furthermore, current stocks are well below the levels observed during the mid-1970s and 1980s. In fact, at the height of the farm financial crisis, corn the ending stocks to use ratio exceeded 50% for three consecutive years (1985/1986 through 1986/1987). Stocks reached a high of 66% of use in 1986/1987. For perspective, a stock ratio of 66% is equal to 9.6 billion bushels at current usage levels (14.6 billion bushels). 9+ billion bushels of corn ending stocks is hard to comprehend in a year when current corn ending stock of 2 billion bushels seems too burdensome.
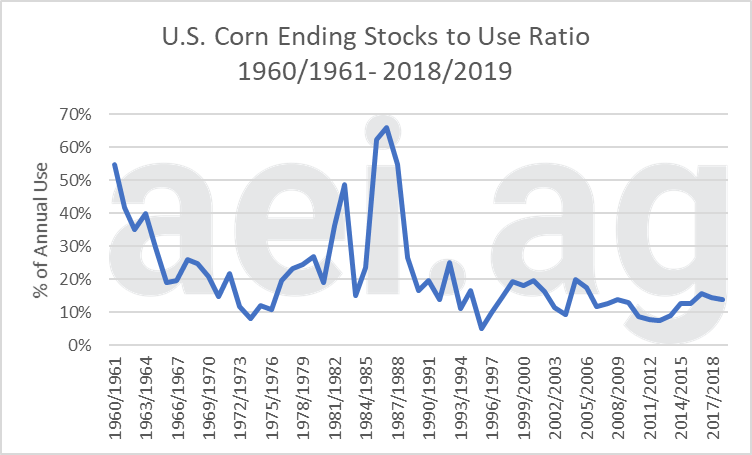 Figure 1. U.S. Corn Ending Stocks, 1960/1961 to 2018/2019. Data Source: USDA ERS.
Figure 2 shows the same corn data since 1990/1991. Also shown, in black, is the 29-year average ending-stocks-to-use levels of 13.8%. Current stocks, at 14.0% of use, are currently in line with the average.
As we have noted in previous posts about ending stocks, how bad the current situation seems is often impacted by 1.) how much one remembers, 2.) how much data one considers, and 3.) or how far back the graphs are drawn.
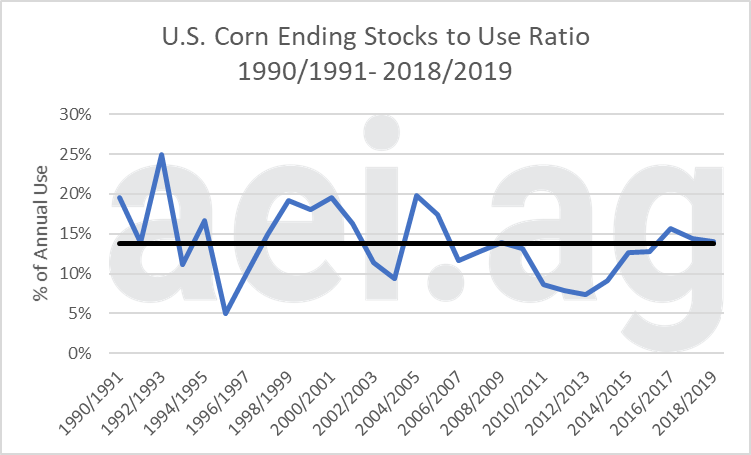 Figure 2. U.S. Corn Ending Stocks. Average: 13.8%, shown in black. 1990/1991 to 2018/2019. Data Source: USDA ERS.
Thinking About 2019/2020
Thinking about the crop being planting now, the 2019/2020 marketing year, what are the possible outcomes? Again, it is early in the growing season, and numerous uncertainties remain; including final acres and prevented plantings. That said, there is an opportunity to frame-up the uncertainty.
The first uncertainty is around production – acres and yields. For this part, we used the USDA’s March Prospective Plantings report (which assumed a more historically normal prevented planting level) as well as an average for the share of harvested acres. Furthermore, we assumed a baseline yield of 176 bushels per acre, which is in line with what USDA has as its first 2019 yield. For variability in production, we considered yields at the 25th and 75th percentile[1]. Of course, many production uncertainties exist between now and harvest; we, however, only show variation from yields.
For possible usage scenarios, we started with trend usage (15.1 billion bushels) and considered a high usage scenario (5% above trend) and a low usage scenario (5% below trend). For comparison, 2018/2019 usage is forecasted at 14.6 billion bushels, which is below the low-usage level (14.3 billion) but below the base level (15.1 billion).
Table 1 report ending stocks (in bushels) and stocks-to-use ratio under the various scenarios. Note we excluded the extremes – high yield/low usage (top right) and low yield/high usage (lower left)- as we would expect prices to respond dramatically.
At one level, these estimates are not surprising: higher yields result in higher stock; higher usage equals lower stocks. With usage approach 15.1 billion – again, about 0.5 billion bushels above 2018/2019 usage- and yields around the baseline of 176, ending stocks could turn lower, compared to 2018/2019 levels. This would be helpful news.
Figure 3 shows data from Figure 2 and the possible outcomes from Table 1. This is another way of framing the possible outcomes. (Note- two data points in Figure 3 are nearly 15%).
The shortcoming and challenge with this back-of-the-envelope process are that price impacts are not directly considered. This is especially true if stocks turned lower. We would expect prices to ration demand if the stocks to use ratio fell below 10% – limiting usage and the decline in stocks.
Table 1. Corn Balance Sheet Scenarios Under Different Yield and Usage Scenarios. 
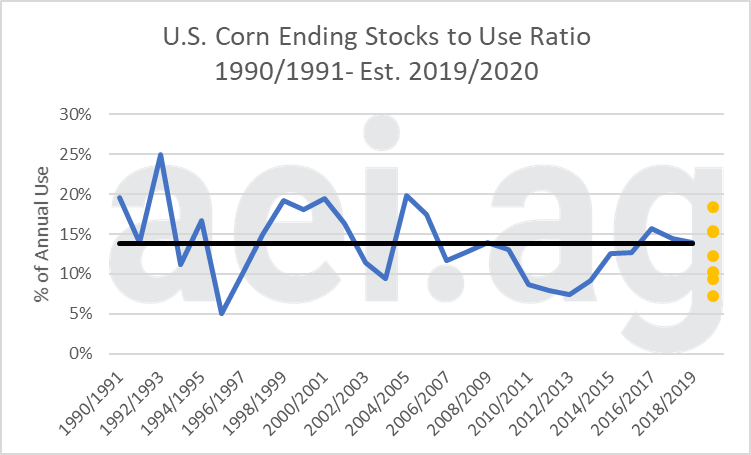 Figure 3. U.S. Corn Ending Stocks. Average: 13.8%, shown in black. 1990/1991 to 2018/2019. Estimated Possible 2019/2020 Levels (yellow). Data Source: USDA ERS, AEI estimates.
Wrapping it Up
As we travel around, the theme of big crops, big yields, and big ending stocks seem to be weighing heavily on everyone mind. This has undoubtedly been the story for corn in recent years. Compounding the gloom is the expectation of higher corn acreage in 2019.
When thinking about stocks, it is always important to consider the stocks-to-use ratio. Additionally, it is helpful to consider multiple years of data. While corn’s stock-to-use ration at some of the highest levels in recent years, it is important to recognize 2018/2019 levels are in line with the 29-year average. Furthermore, stock ratios have turned lower in recent years.
Thinking about 2019, the usage story will be key. The scenarios with low usage resulted in ending stocks turning higher in 2019/2020. Low usage would be a bleak outcome and highlights the concerns many have surrounding trade uncertainties.
For 2019, important corn benchmark numbers will be national yields of 176 bushels and usage of 15.1 billion bushels.
Interested in learning more? Follow AEI’s Weekly Insights by clicking here. Also, follow AEI on Twitter and Facebook.
[1] Consistent with the USDA, yield data from 1988 were detrended for this.